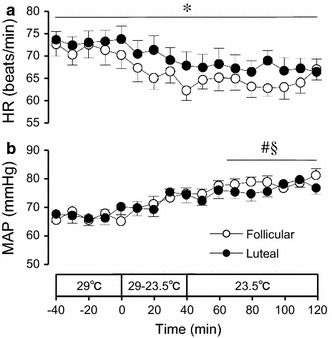
Fig. 2.

Heart rates (HR, a) and mean arterial pressure (MAP, b) in the follicular and luteal phases. Values are mean ± SE (n = 8). *P < 0.05, significant differences between the follicular and luteal phases; #P < 0.05, significant differences from the baseline value at 0 min in the follicular phase; §P < 0.05, significant differences from the baseline value at 0 min in the luteal phase
