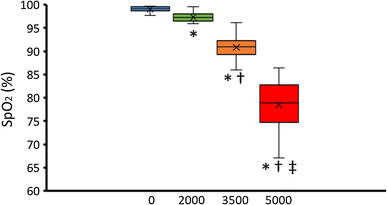
Fig. 4.

The box-and-whisker plots for SpO2 under normoxic (0), mild (2000), moderate (3500), and severe (5000) hypoxic conditions. The tops and bottoms of the boxes are third and first quartiles, respectively. The upper and lower ends of the whiskers represent the highest data points within 1.5 interquartile ranges of the upper quartiles and the lowest data points within 1.5 interquartile ranges of the lower quartiles, respectively. The bands inside the boxes indicate medians. The x’s show averages. *p < 0.05 vs. normoxic condition, †p < 0.05 vs. mild hypoxic condition, ‡p < 0.05 vs. moderate hypoxic condition
