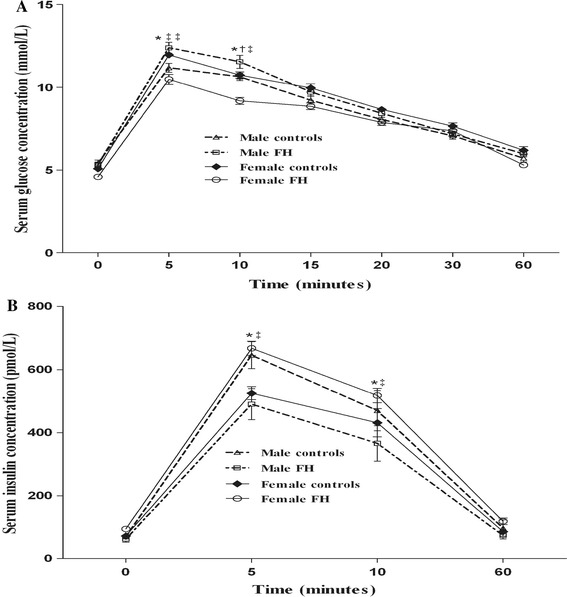
Fig. 4.

Evaluation of intravenous glucose tolerance test (IVGTT). Comparison of changes in serum glucose (a) and insulin (b) concentrations following IVGTT at different time points in the male (n = 12) and female (n = 12) fetal hypothyroid (FH) and control rats. *p < 0.01, statistically significant differences between different sexes, † p < 0.05, ‡ p < 0.01, statistically significant differences between different treatments (FH and controls)
