
Fig. 2.
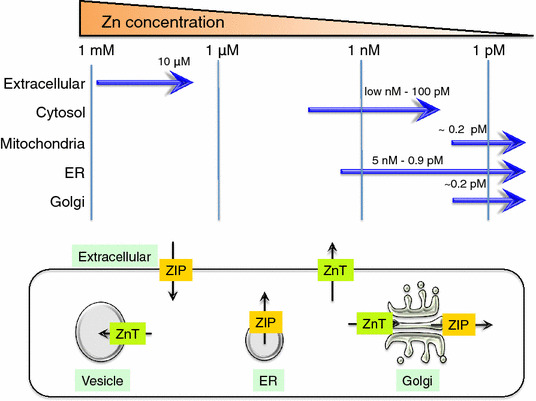
Zn storage and distribution in intracellular compartments. The upper diagram shows Zn concentrations in the extracellular region and the cellular compartments (cytosol, mitochondria, ER, and Golgi). The lower diagram shows the direction of Zn transport (black arrows) elicited by ZIP (orange) and ZnT (green) proteins expressed on these cellular compartments