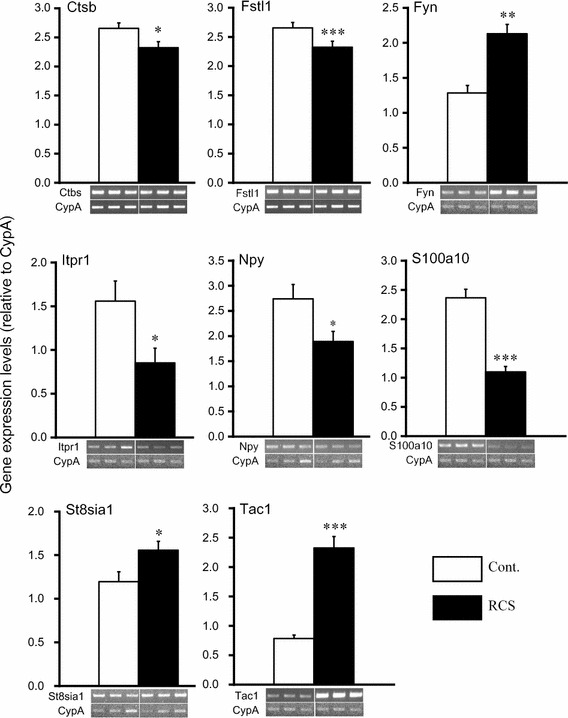
Fig. 5.

Changes in gene expression of pain-related genes in DRGs induced by RCS. Analysis of the pain-related gene expression levels in the control group (white bars) and RCS group (black bars) was performed using RT-PCR. Significant changes in the expression of eight pain-related genes were observed. The values were normalized by the level of CypA. Each column and bar represent the mean and SE (n = 12, respectively). *p < 0.05, **p < 0.01 and ***p < 0.001 vs. control by Student’s t test. Three representative images of each RT-PCR amplification in the control (left hand side) and RCS group (right hand side) are also shown, respectively
