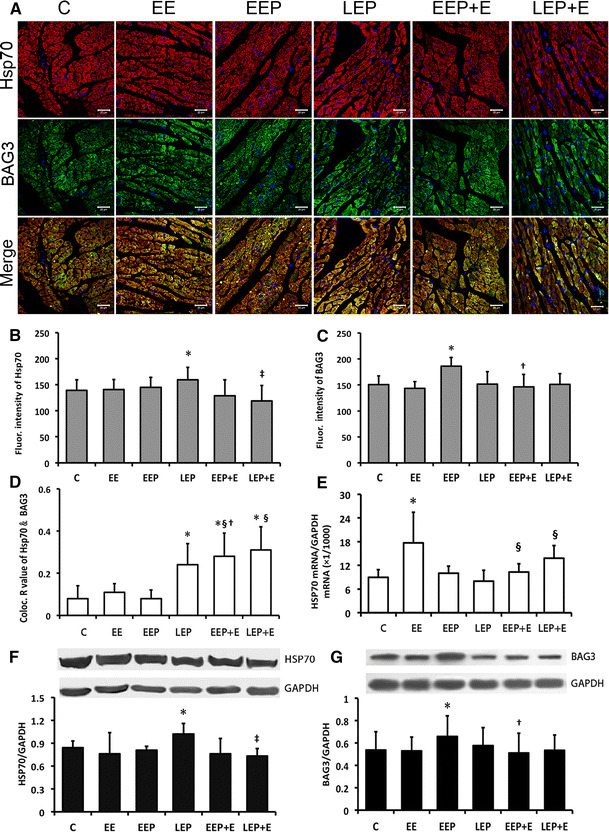
Fig. 2.

HSP70 and BAG3 expression and interaction changes in rat myocardium. a, b Laser scanning images. Hsp70 shows immunoreactive products (red) appeared as relatively evenly distributed granules within the myocardium. The BAG3 images show green immunoreactive products distributed as aggregates in the myocardium. The merged images show more dispersed distribution of red and green fluorescence in groups C, EE and EEP. Original magnification ×400; bar 20 μm. b Average integral optical density (AIOD) value of HSP70 immunoreactive image analysis in cardiomyocytes indicates the LEP group compared with the C group. The difference was significant, *P < 0.05. The LEP + E group compared with the LEP group was significantly different, ‡ P < 0.05. c AIOD value of BAG3 immunoreactive image analysis in cardiomyocytes indicates that in the EEP group compared with the C group, the difference was significant, *P < 0.05. The EEP + E group compared with the EEP group was significantly different, † P < 0.05. d The co-localization R values of Hsp70/BAG3 in the LEP, EEP + E and LEP + E groups compared with the C group were significantly different, *P < 0.05. The EEP + E and LEP + E groups compared with EE showed a significant difference, § P < 0.05. The EEP + E group compared with the EEP group was significantly different, † P < 0.05. e For HSP70 mRNA level changes in EP and EP-induced cardioprotection, the EE group compared with group C was significantly different, *P < 0.05. The EEP + E group and LEP + E group compared with the EE group were significantly different, § P < 0.05. f HSP70 protein expression changes in EP and EP-induced cardioprotection detected by immune blotting. In the LEP group compared with the C group, the difference was significant, *P < 0.05. The LEP + E group compared with the LEP group was significantly different, ‡ P < 0.05. g BAG3 protein expression changes in EP and EP-induced cardioprotection detected by immune blotting. In the EEP group compared with the C group, the difference was significant, *P < 0.05. The EEP + E group compared with the EEP group was significantly different, † P < 0.05. C control, EE exhaustive exercise, EEP early exercise preconditioning, LEP late exercise preconditioning, EEP + E early exercise preconditioning plus exhaustive exercise, LEP + E late exercise preconditioning plus exhaustive exercise (color figure online)
