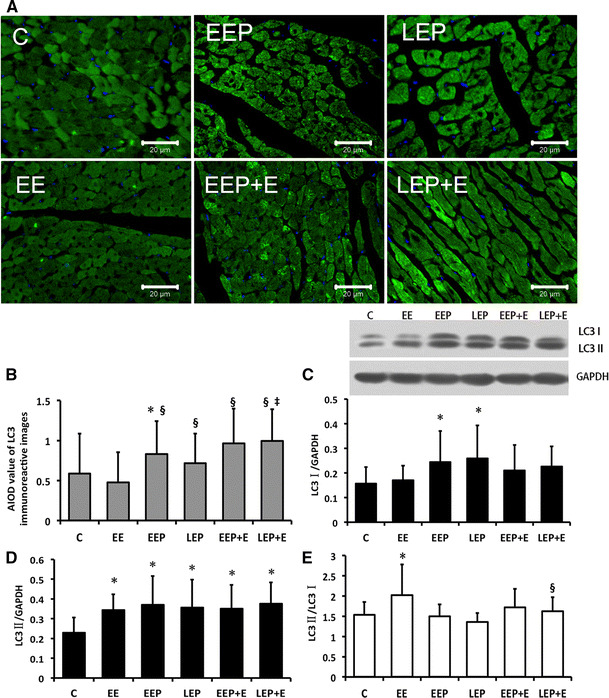
Fig. 4.

LC3 expression changes in rat myocardium. a, b LC3 immunofluorescence expression in cardiomyocytes. Immunoreactive regions of each group were stained bright green. As observed, positive products in the C group were significantly less than in other groups except the EE group. Original magnification, ×400; bar 20 μm. b Average integral optical density (AIOD) value of LC3 immunoreactive image analysis in cardiomyocytes indicates the level in the EEP group was significantly higher than in the C group, *P < 0.05. All groups were significantly higher than the EE group except for the C group, § P < 0.05. Compared with the LEP group, the LEP + E group was significantly different, ‡ P < 0.05. c, d Presented LC3 protein expression changes in EP and EP-induced cardioprotection detected by immune blotting. c LC3I protein expression: the difference between the LEP group and C group was significant, *P < 0.05. d LC3II protein expression: the EE, EEP, LEP, EEP + E and LEP + E groups were significantly different compared with the C group, *P < 0.05. e LC3II/I ratio changes in EP and EP-induced cardioprotection: the EE group was significantly different compared with the group C, *P < 0.05. The LEP + E group was significantly different compared with the EE group, § P < 0.05. C control, EE exhaustive exercise, EEP early exercise preconditioning, LEP late exercise preconditioning, EEP + E early exercise preconditioning plus exhaustive exercise, LEP + E late exercise preconditioning plus exhaustive exercise (color figure online)
