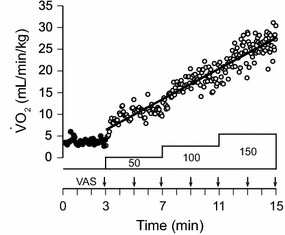
Fig. 1.

Pulmonary O2 uptake (VO2) during exercise in one participant. Exercise testing was performed on an electrically braked bicycle ergometer. After a 3-min rest (filled circles), he started exercise at an initial work rate of 50 W, which was increased in a stepwise manner by 50 W every 4 min to 150 W. The VO2 values at each time during exercise (open circles) were predicted by regression analysis between time and VO2. The intensity of dyspnea was measured using a 100-mm horizontal visual analog scale (VAS) at 2-min intervals
