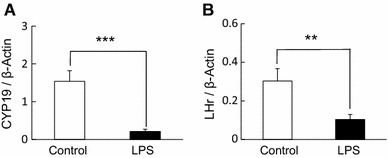
Fig. 5.

Effect of LPS on CYP 19 and LHr in the mouse ovary The quantified data of CYP19 (a) and LHr (b) expression in ovary (ZT 24 on day 2) from mice with (n = 4) or without (n = 4) LPS treatment 48 h after eCG injection (**P < 0.01, ***P < 0.001). Data are presented as mean ± SEM
