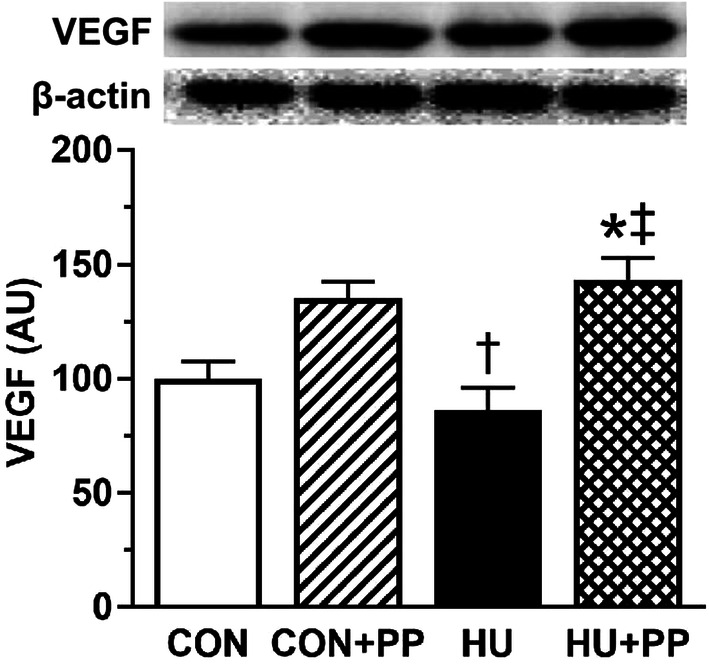
Fig. 6.

Mean levels of vascular endothelial growth factor (VEGF) protein expression in the soleus muscles of each group. Values are shown as the mean (bars) ± SEM (error bars). The asterisk (*), dagger (†), and double dagger (‡) indicate a significant difference from the CON, CON + PP, and HU groups, respectively, at P < 0.05
