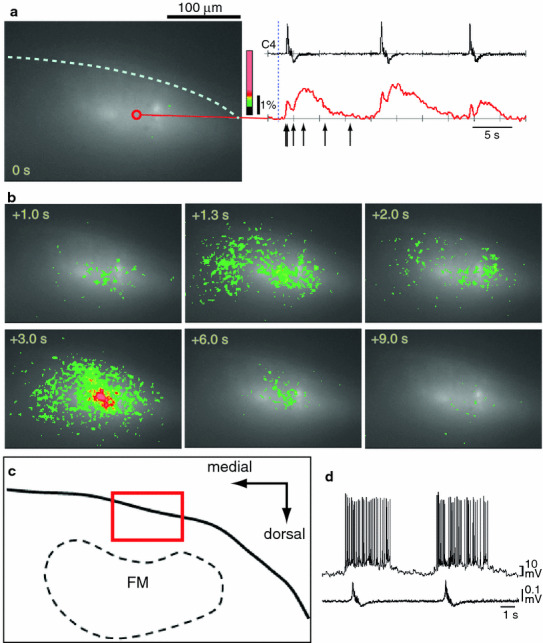
Fig. 2.

Calcium imaging of respiratory neuron activity in the ventral medulla of the rostral cut surface following the dye-injection method. Results are from a single sweep continuous recording with a 100 ms sampling rate and 512 frames (total recording period of 51.2 s). a An optical image of the rostral cut surface at the time point represented by the dotted vertical line (i.e. time 0 s) in the right column where C4 activity and fluorescence change at one position (red open circle) is indicated. b Optical images of respiratory neuron activity. The images are arranged in a time course from left to right and top to bottom, as indicated by the numeric values. Each image corresponds to arrows in (a). c Illustration of the cut surface of the rostral medulla at lower magnification. The red square denotes the area of the optical recording. FN Facial nucleus. d A typical example of a parafacial pre-inspiratory neuron recorded in a similar area of another preparation
