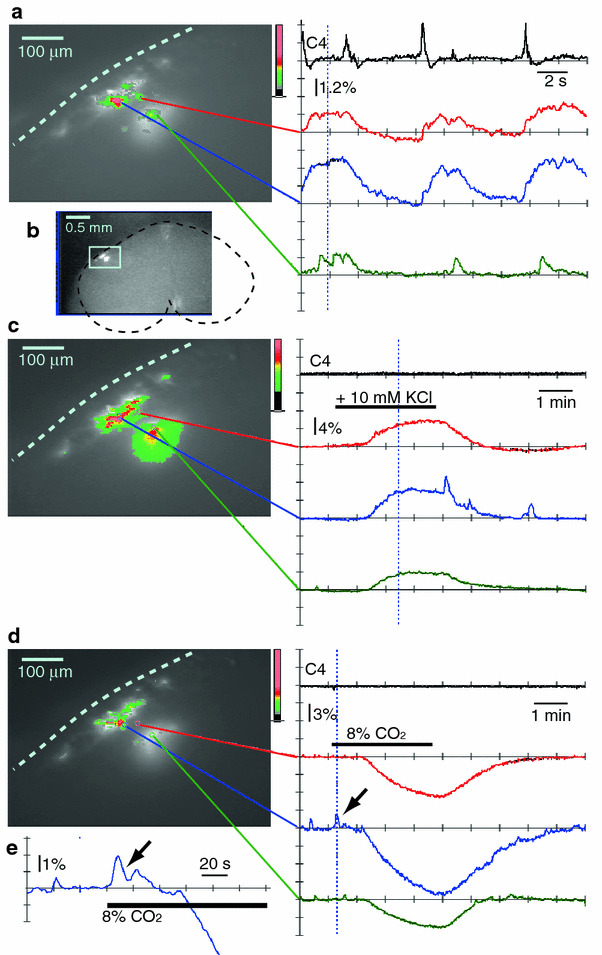
Fig. 3.

Long-term monitoring of respiratory neuron activity in the ventral medulla of the rostral cut surface with calcium imaging following the dye-injection method. Optical images of the rostral cut surface in the left column (a, c, d) show the time points represented by the dotted vertical lines in the right column. a Results from a single sweep continuous recording with a 40 ms sampling rate and 512 frames (total recording period of 20.5 s). b An optical image of the cut surface of the rostral medulla at lower magnification. The light blue square denotes the area of the optical recording. c Long-term monitoring of the fluorescence change in response to high K+ stimulation (+10 mM) in the presence of 0.5 μM TTX. Results are from a single sweep recording with the short exposure (SE) mode; 100 ms sampling at every second for 8.5 min (512 frames). Note the large increase in the fluorescence intensity during exposure to the high K+ solution. d Long-term monitoring of the fluorescence change in response to high CO2 stimulation (2→8%) in the presence of 0.5 μM TTX. Note that high CO2 stimulation initially induced a transient increase in the fluorescence intensity (arrow, e) followed by a large decrease
