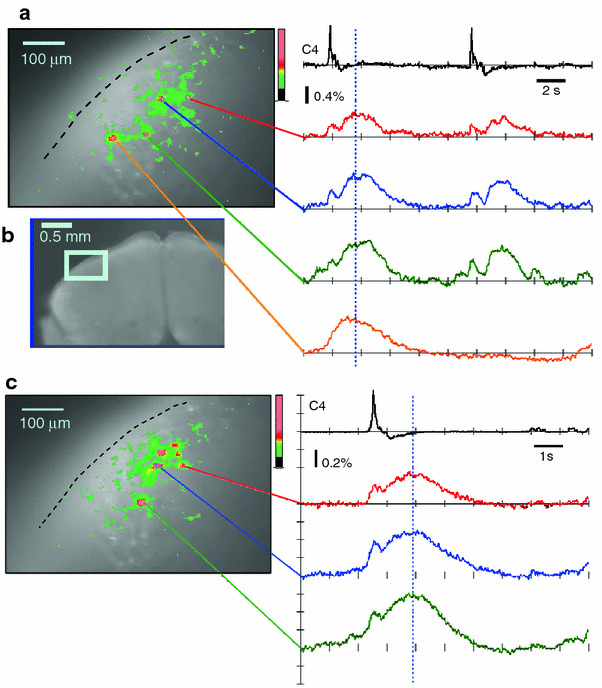
Fig. 4.

Calcium imaging of respiratory neuron activity in the ventral medulla of the rostral cut surface after cell staining by the incubation method. Optical images of the rostral cut surface in the left column (a, c) show the time points represented by the dotted vertical lines in the right column. a Results from a single sweep continuous recording with a 40 ms sampling rate and 512 frames (total recording period of 20.5 s). b An optical image of the cut surface of the rostral medulla at lower magnification. The light blue square denotes the area of the optical recording. c Results from 10 times averaging where the C4 burst was used to trigger the acquired images (20 ms sampling rate, 512 frames)
