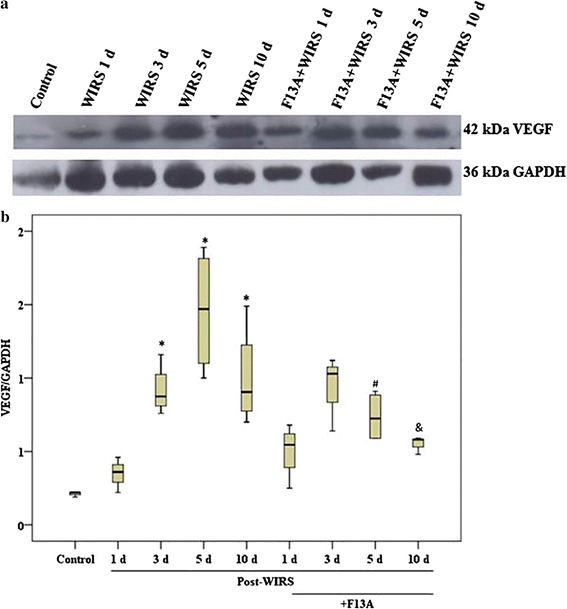
Fig. 5.

VEGF expression in gastric mucosa samples obtained from the stressed rats treated with and without F13A (150 µg/kg b.w., i.v.) during gastric lesion healing on the 1st, 3rd, 5th or 10th day after the end of stress induction. a Representative appearance of VEGF expression in the gastric samples of the experimental groups. b Graphic of the mathematical values of the VEGF/GAPDH ratios in the gastric samples. Data are presented as box plots showing the range, quartiles (25–75 %) and median. *p < 0.05 vs. the control group, # p < 0.05 vs. the WIRS 5 day group and & p < 0.05 vs. the WIRS 10 day group) (n = 4 rats/group)
