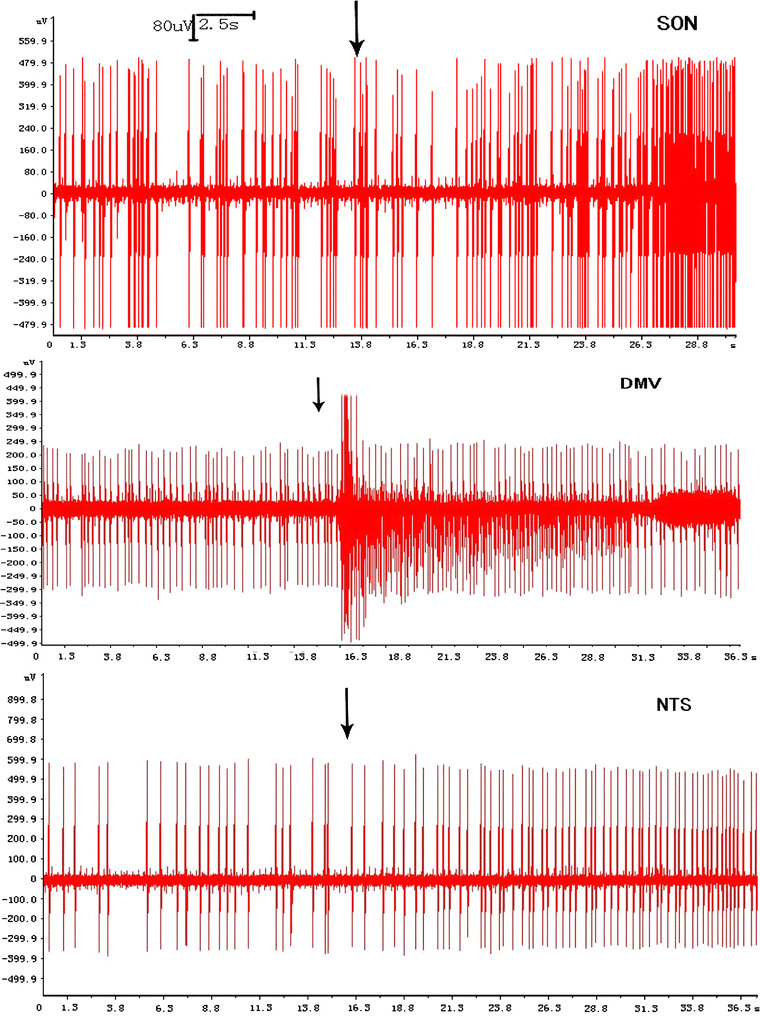
Fig. 2.

Representative discharge diagram of the SON (n = 7), DMV (n = 5) and NTS (n = 5). Compared with before microinjection, the discharge frequencies of all three nuclei increased, the black arrow represents the cold saline stimulus, the x-axis represents time (s), and the y-axis represents amplitude of spikes (μV)
