
Fig. 3.
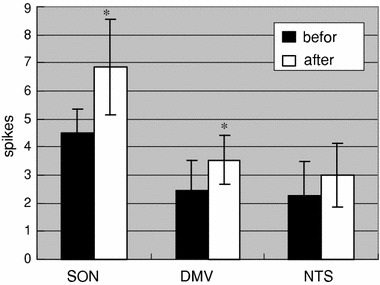
Effects of 4°C physiological saline stimulus on discharge frequency of the SON (n = 7), DMV (n = 5) and NTS (n = 5), 180 s after stimulus versus before stimulus; y-axis represents discharge frequency (spikes/s), *P < 0.05
Official websites use .gov
A
.gov website belongs to an official
government organization in the United States.
Secure .gov websites use HTTPS
A lock (
) or https:// means you've safely
connected to the .gov website. Share sensitive
information only on official, secure websites.
Effects of 4°C physiological saline stimulus on discharge frequency of the SON (n = 7), DMV (n = 5) and NTS (n = 5), 180 s after stimulus versus before stimulus; y-axis represents discharge frequency (spikes/s), *P < 0.05