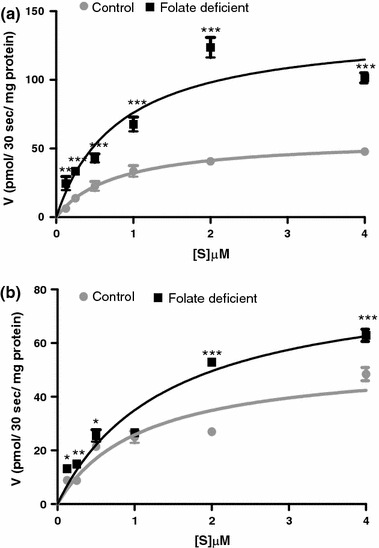
Fig. 4.

Uptake of [3H]folic acid in the renal BBM (a) and BLM (b), as a function of substrate (S) concentration. Uptake was measured by varying [3H]folic acid concentration from 0.125 to 4.0 μM in the incubation medium (100 mM NaCl, 80 mM mannitol, 10 mM HEPES, 10 mM 2-morpholinoethanesulfonic acid, pH 5.5 or 6.0) after incubating renal BBMV for 30 s. Each data point is the mean ± SD of 4 separate uptake determinations. *p < 0.05, **p < 0.0 l, ***p < 0.001 vs. control
