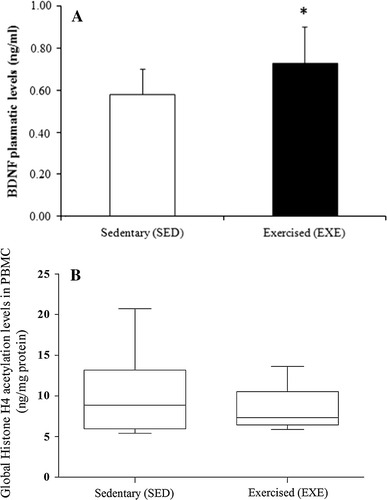
Fig. 1.

a Plasma BDNF levels in the SED (n = 8) and EXE (n = 18) groups in the basal period. Results are expressed as average ± standard deviation; t test (p = 0.036) *statistically different from the SED group. b Global histone H4 acetylation levels in PBMCs from SED (n = 8) and EXE (n = 18) groups in the basal period. Mann–Whitney test (p = 0.601)
