
Fig. 2.
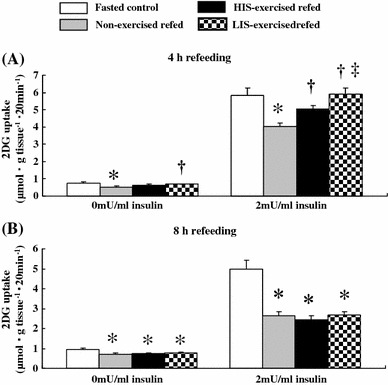
Basal and insulin-stimulated 2DG uptake rates in epitrochlearis muscles after 4 or 8 h of refeeding in time-matched fasted controls, non-exercised refed rats, HIS-exercised refed rats, and LIS-exercised refed rats. Open bars time-matched fasted controls, gray bars non-exercised refed rats, filled bars HIS-exercised refed rats, dark gray bars LIS-exercised refed rats. See the legend of Fig. 1 for a description of the animal treatment. The values are expressed as the mean ± SE; n = 6–7 muscles/group for basal 2DG uptake and n = 7–10 muscles/group for insulin-stimulated 2DG uptake. *Significant differences P < 0.05, non-exercised refed, HIS-exercised refed, or LIS-exercised refed rats versus time-matched fasted controls. †Significant differences P < 0.05, HIS-exercised refed or LIS-exercised refed rats versus non-exercised refed rats. ‡Significant differences P < 0.05, LIS-exercised refed rats versus HIS-exercised refed rats