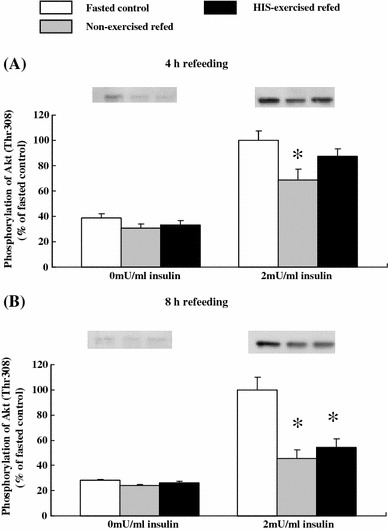
Fig. 4.

Basal and insulin-stimulated Thr308 phosphorylation of Akt in epitrochlearis muscles after 4 or 8 h of refeeding in time-matched fasted controls, non-exercised refed rats, and HIS-exercised refed rats. Open bars time-matched fasted controls, gray bars non-exercised refed rats, filled bars HIS-exercised refed rats. The mean values for insulin-stimulated phosphorylation of time-matched fasted controls were set at 100.0 arbitrary OD units. Representative Western blots of Thr308 phosphorylation of Akt are shown at the top of the figure. See the legend of Fig. 1 for a description of the animal treatment. Values are expressed as the mean ± SE; n = 6 muscles/group for basal phosphorylation and n = 6–8 muscles/group for insulin-stimulated phosphorylation. *Significant differences P < 0.05, non-exercised refed or HIS-exercised refed rats versus time-matched fasted controls
