
Fig. 3.
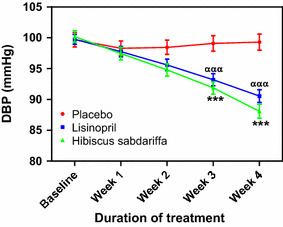
Effect of treatments on diastolic blood pressure (DBP). Each point on the graph represents the average of at least 25 independent measurements. Error bars SEM. ***P < 0.001 (placebo vs. H. sabdariffa); ααα P < 0.001 (placebo vs. lisinopril). All analyses were performed with two-way ANOVA with the Bonferroni posttest using the GraphPad Prism 5.0 analysis program