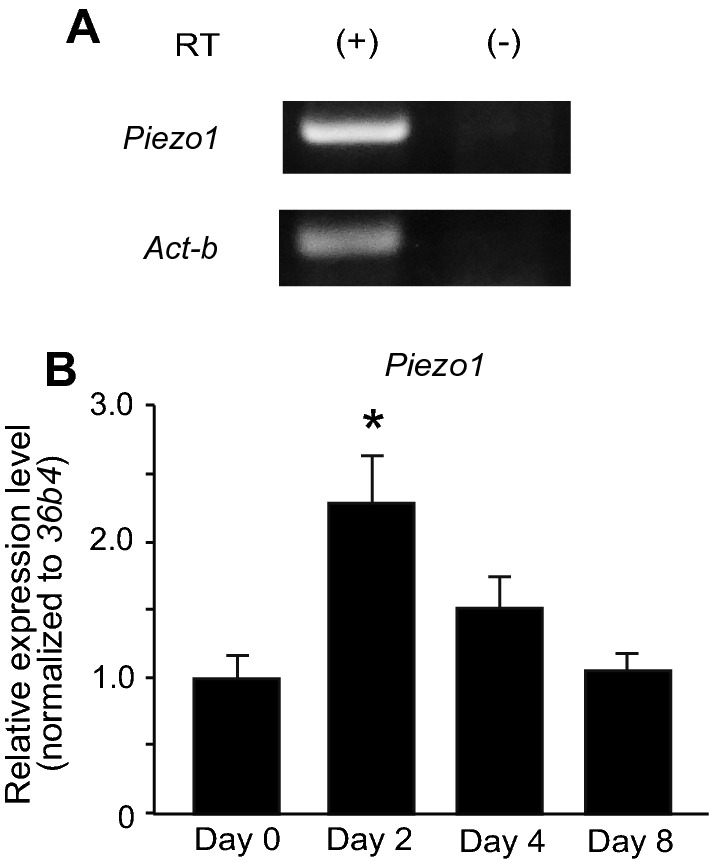
Fig. 1.

The mRNA expression of Piezo1 in mouse brown adipocytes. A RT-PCR analysis of Piezo1 and Act-b expression in pre-adipocytes. RT ( +) and (−) indicate the samples treated with and without reverse transcriptase (RT), respectively. B RT-qPCR analysis of Piezo1 expression in pre-adipocytes (Day 0), inducted adipocytes (Day 2), and differentiated brown adipocytes (Days 4 and 8). Each expression level was normalized to that of 36b4. Each column represents the mean + SEM of 5 experiments. Statistical significance was assessed using ANOVA followed by two-tailed multiple t-tests with Bonferroni correction. *p < 0.05 vs. Day 0
