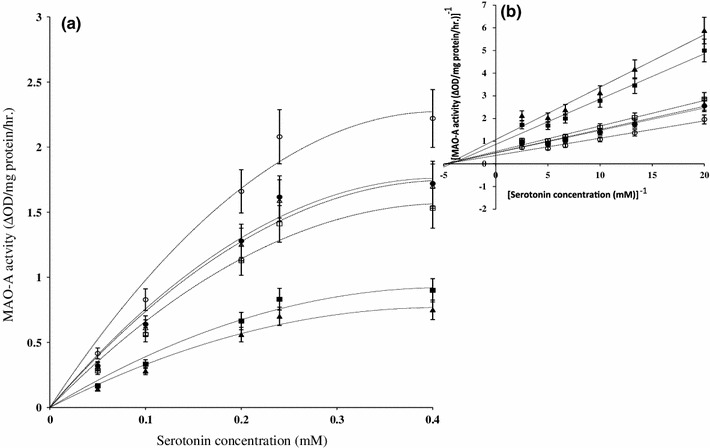
Fig. 2.

a Effect of serotonin concentration variation (0.05–0.4 mM) on platelet MAO-A activity. Results are expressed as mean ± SEM (n = 4–6). Each observation was made from a single rat. Line (–) represents control, filled circle young (4 months) rats, filled square aged (18 months) rats, filled triangle aged (24 months) rats. Broken line (---) indicates carnosine treated, open circle young (4 months) rats, open square aged (18 months) rats, open triangle aged (24 months) rats. b Line–Weaver Burk plot of blood platelet MAO-A activity in different ages of rats. Line–Weaver Burk plots were drawn from the progress curve with varying substrate concentration as presented in a
