
Fig. 1.
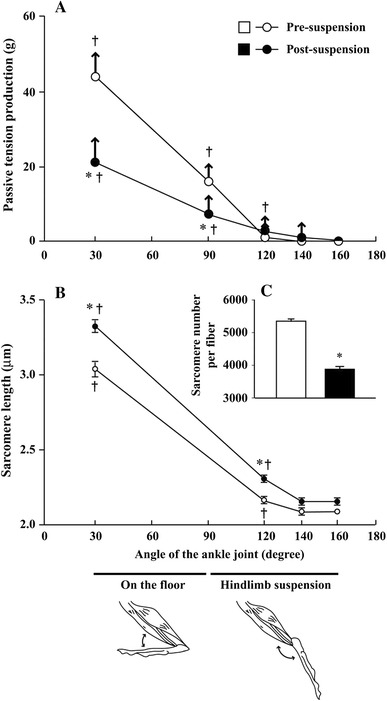
Relationship between the anterior angle of the ankle joint and passive (open and closed circles) and active (arrows) tension development (A: n = 5 for each group) and the mean in vivo length of sarcomeres (B; 10 rats for each group and 5 muscles or 5 × 30 fibers for each angle) before and after 14-day hindlimb suspension. The total sarcomere number per fiber is also illustrated (C; 5 muscles or 5 × 60 fibers for each group). Mean ± SEM. * and †: p < 0.05 vs. pre-suspension control and the levels at a 160° ankle joint angle, respectively. Cited from [15]