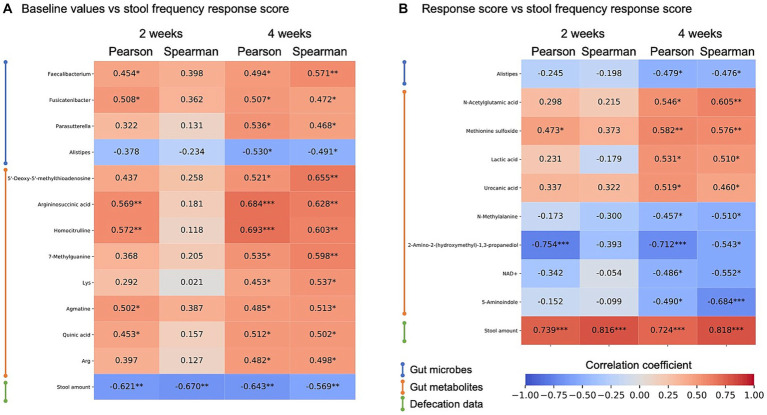
Figure 4.
Heatmap of correlation analysis of stool frequency response score. Correlation analysis between stool frequency response scores and gut enviromental features of (A) baseline value correlations and (B) response score correlation, and its correlation coefficient is shown by heatmap. Items showing significant correlations were extracted at 4 weeks of intake. Heatmap rows were sorted by data type and 4-week Spearman correlation coefficient value. *, p < 0.05; **, p < 0.01; ***, p < 0.001, p-values were calculated by correlation coefficient ‘s no correlation test.

