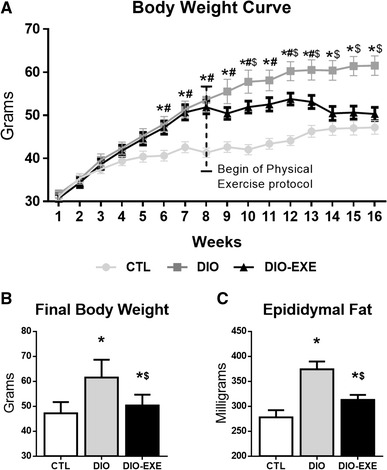
Fig. 3.

Physiological parameters of control (CTL), obese (DIO) and trained obese (DIO-EXE) groups. a Body weight curve during 16 weeks. b Final body weight at the end of 16 weeks. c Epididymal weight. Bars represent means and SEM of CTL, DIO and DIO-EXE mice (n = 7–10). *p < 0.05 for CTL versus DIO group; # p < 0.05 for CTL versus DIO-EXE group; $ p < 0.05 for DIO versus DIO-EXE group
