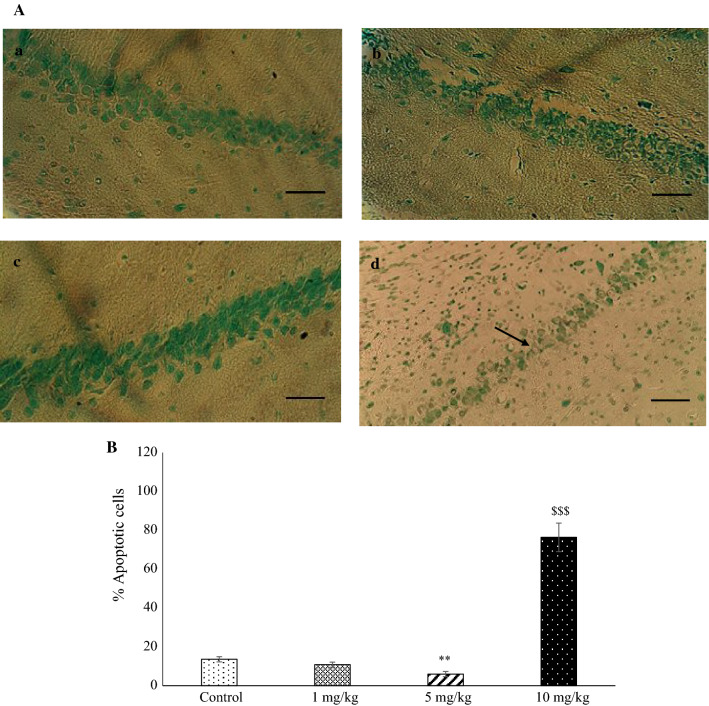
Fig. 6.
Light micrographs of cell apoptosis in the hippocampal CA1 region. a Sections derived from a: control; b: METH (1 mg/kg); c: METH (5 mg/kg); and d: METH (10 mg/kg) groups stained by TUNEL. The arrow shows an apoptotic neuron. The mean percentage of apoptotic cells was measured (b) **P < 0.01 as compared with the control group, $$$P < 0.001 as compared with the METH (5 mg/kg) group. Each column represents mean ± SEM. Scale bar = 50 μm, magnification: × 400

