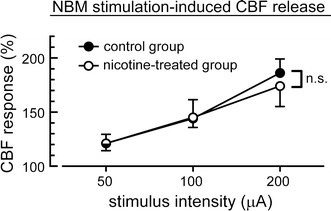
Fig. 6.

Relationships between stimulus intensity (x-axis) and magnitude of cerebral blood flow (CBF) responses (y-axis) in aged rats of the saline-treated control group and nicotine-treated group. The magnitude of the response during the stimulus period is expressed as a percentage of the pre-stimulus control value for 3 min just before the stimulation, and are summarized as the mean ± SEM. n.s. non-significant difference between the responses by two-way factorial ANOVA
