
Fig. 3.
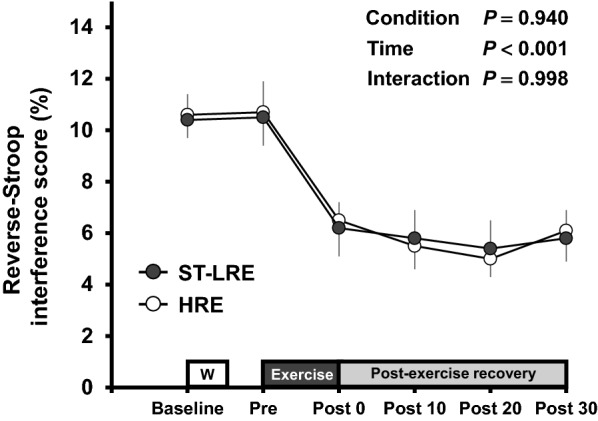
Changes in the reverse-Stroop interference scores throughout ST-LRE and HRE sessions. Values are presented as mean ± SEM. Individual P values and effect sizes [95% confidence intervals] among time points are summarized in Table 3
Official websites use .gov
A
.gov website belongs to an official
government organization in the United States.
Secure .gov websites use HTTPS
A lock (
) or https:// means you've safely
connected to the .gov website. Share sensitive
information only on official, secure websites.
Changes in the reverse-Stroop interference scores throughout ST-LRE and HRE sessions. Values are presented as mean ± SEM. Individual P values and effect sizes [95% confidence intervals] among time points are summarized in Table 3