
Fig. 8.
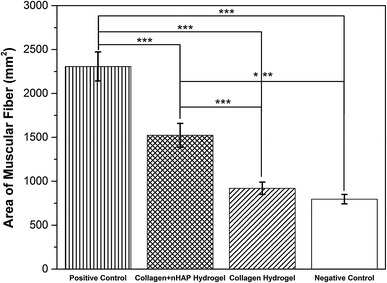
Histogram comparing the cross-sectional area of the gastrocnemius muscle. Values represent the mean ± SD, n = 4, ***P < 0.005 (obtained by one-way ANOVA)
Official websites use .gov
A
.gov website belongs to an official
government organization in the United States.
Secure .gov websites use HTTPS
A lock (
) or https:// means you've safely
connected to the .gov website. Share sensitive
information only on official, secure websites.
Histogram comparing the cross-sectional area of the gastrocnemius muscle. Values represent the mean ± SD, n = 4, ***P < 0.005 (obtained by one-way ANOVA)