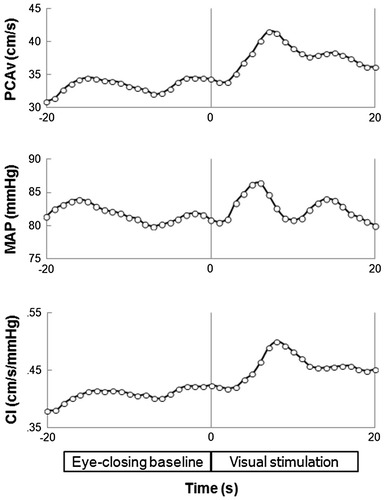
Fig. 1.

The time series of PCAv, MAP, and CI immediately before and after visual stimulation during resting baseline in the control trial in a subject. Looking at a reversed checkerboard increased the PCAv, accompanied by an increase in MAP and PCA CI
