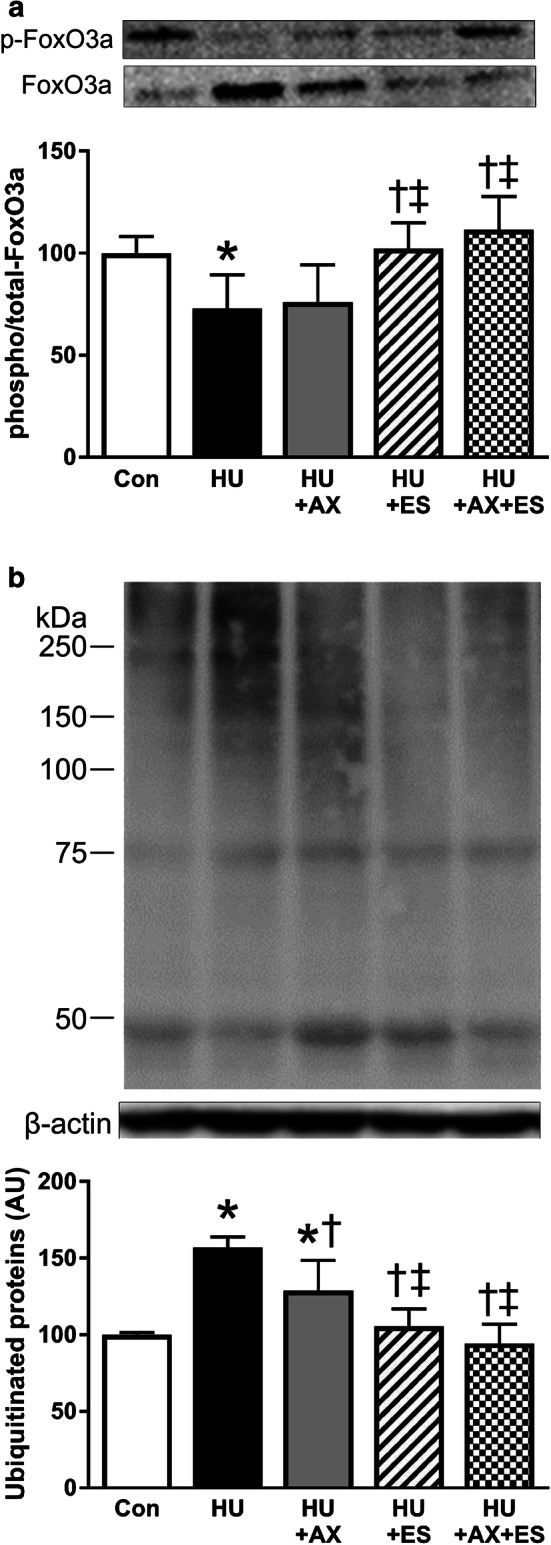
Fig. 2.

Phosphorylated/total FoxO3a protein expression (a) and ubiquitinated proteins expression (b) in each group. Values indicate mean ± SEM. The symbols *, †, ‡, and §significant differences from the Con, HU, HU + AX, and HU + ES groups, respectively, at p < 0.05. Con control group, HU hindlimb unloading group, HU + AX hindlimb unloading plus astaxanthin treatment group, HU + ES hindlimb unloading plus electrical stimulation group, HU + AX + ES hindlimb unloading plus astaxanthin treatment with electrical stimulation group, SEM standard error of mean
