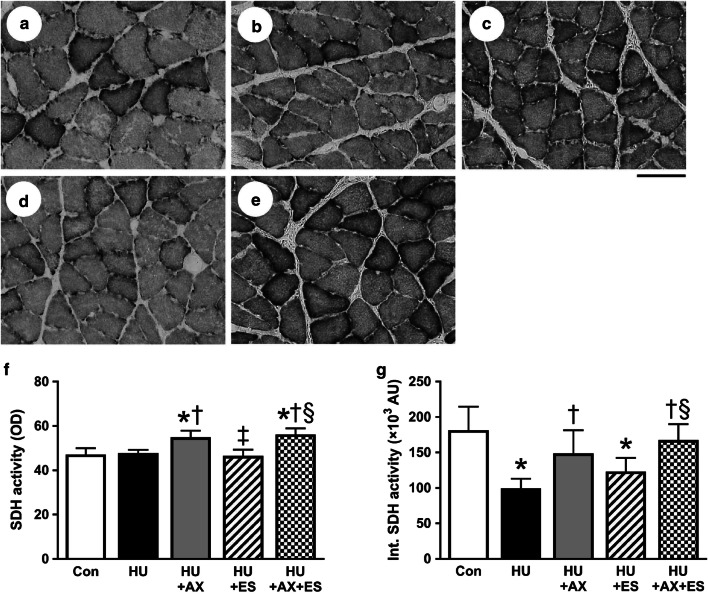
Fig. 3.
Representative images of SDH staining of the soleus muscle in Con (a), HU (b), HU + AX (c), HU + ES (d), and HU + AX + ES (e) groups. SDH activity (f) and integrated SDH activity (g) in each group. Scale bar represents 100 μm. Values indicate mean ± SEM. The symbols *, †, ‡, and §significant differences from the Con, HU, HU + AX, and HU + ES groups, respectively, at p < 0.05. Con control group, HU hindlimb unloading group, HU + AX hindlimb unloading plus astaxanthin treatment group, HU + ES hindlimb unloading plus electrical stimulation group, HU + AX + ES hindlimb unloading plus astaxanthin treatment with electrical stimulation group, SEM standard error of mean

