Fig. 3.

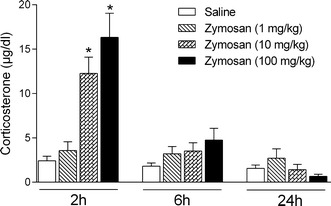
Corticosterone plasma concentrations were measured 2, 6, and 24 h after the administration of zymosan (1, 10, or 100 mg/kg) or saline in mice. Columns and error bars represent mean ± SEM. *p < 0.05 compared with the saline-treated group

Corticosterone plasma concentrations were measured 2, 6, and 24 h after the administration of zymosan (1, 10, or 100 mg/kg) or saline in mice. Columns and error bars represent mean ± SEM. *p < 0.05 compared with the saline-treated group