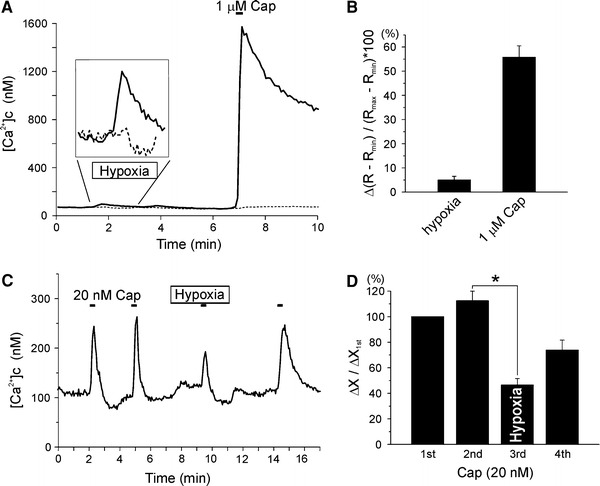
Fig. 7.

Effects of hypoxia on [Ca2+]c in TRPV1-expressing HEK293T cells. a Exemplary traces of [Ca2+]c for TRPV1-expressing (solid lines) and empty (dotted line) HEK293T cells. [Ca2+]c was increased by hypoxia in TRPV1-expressing HEK293T cells but not in empty HEK293T cells (see inset for the vertical expansion). The expression of TRPV1 was confirmed from the large increase in [Ca2+]c by 1 μM capsaicin. b Summary of normalized [Ca2+]c increase caused by hypoxia and 1 μM capsaicin (n = 9), respectively. The fluorescence ratio were normalized to the maximum R max and R min obtained by ionomycin (2 μM) and EGTA (5 mM) at the end of each experiment (see “Materials and methods”). c Representative trace of [Ca2+]c showing the transient increases in [Ca2+]c (Δ[Ca2+]c) by 20 nM capsaicin. Under hypoxia, the Δ[Ca2+]c by 20 nM capsaicin was attenuated. d Summary of Δ[Ca2+]c normalized to the first response to 20 nM capsaicin (n = 6)
