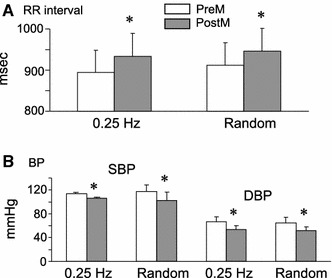
Fig. 1.

Cardiovascular changes after the application of a pressure stimulus over trigger points (TPs) in the lower-limb muscle. a Changes in mean RR interval on the electrocardiograms (n = 6). b Changes in mean systolic and diastolic blood pressure (SBP and DBP, respectively; n = 6). A significant increase in mean RR intervals and a significant decrease in mean SBP and DBP were observed after the application of pressure stimulus during constant and random frequency breathing. No difference was observed between the values measured during constant and random frequency breathing. PreM Before pressure application over TPs, PostM after pressure application over TPs, 0.25 Hz constant frequency breathing at 0.25 Hz, random random frequency breathing. *P < 0.05
