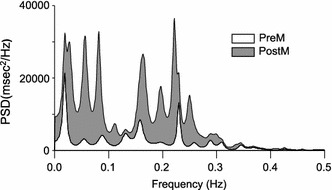
Fig. 2.

An example of a spectral analysis of the RR interval. Low-frequency (LF) and high-frequency (HF) components increased after pressure application over the TPs. Vertical scale Power spectral density (PSD), horizontal scale frequency (LF component 0.05–0.15 Hz; HF component 0.15–0.50 Hz). See caption to Fig. 1 for explanation of abbreviations
