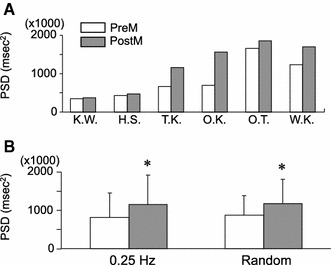
Fig. 3.

Changes in the HF component of heart rate (HR) variability after pressure application over TPs in the lower-limb muscle. a Changes in the HF component in each subject (n = 6). Initials of each subject appear under the horizontal scale. b Changes in the mean HF component (n = 6). A significant increase in the mean HF component was observed after the application of pressure stimulus during constant and random frequency breathing. No difference was observed between the values measured during constant and random frequency breathing. See caption to Fig. 1 for explanation of abbreviations
