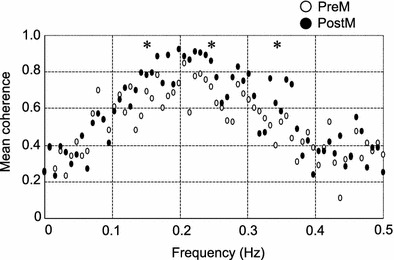
Fig. 4.

Change in mean coherence during random frequency breathing after the application of pressure over the TPs in the lower-limb muscle. Changes in mean coherence between instantaneous lung volume (ILV) and HR after the application of pressure over TPs is shown. The vertical and horizontal scales represent the mean coherence between ILV and HR (n = 6) and breathing frequency (Hz), respectively. The mean coherence both before and after pressure application indicated a strong correlation in the HF breathing zone (0.15–0.50 Hz). Asterisk indicates significant difference from the control (preM) (P < 0.05)
