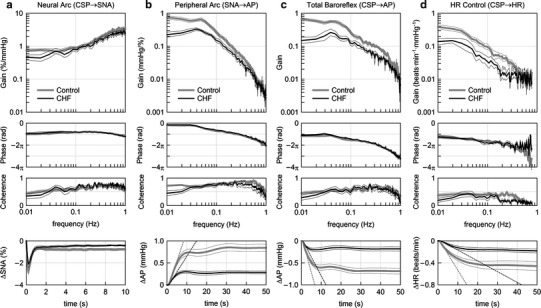
Fig. 3.

Dynamic characteristics of the carotid sinus baroreflex averaged for the control rats (n = 12) and chronic heart failure (CHF) rats (n = 7). a Transfer function of the baroreflex neural arc from CSP to SNA. Gain, phase, and coherence plots are shown. The bottom panel represents the step response of SNA calculated from the transfer function. There is no significant difference in the negative peak response or the time to peak between control and CHF rats. b Transfer function of the baroreflex peripheral arc from SNA to AP. The bottom panel represents the step response of AP induced by a unit increase in SNA. Both initial slope (dotted lines) and steady-state response are attenuated in CHF. c Transfer function of the total baroreflex from CSP to AP. The bottom panel represents the step response of AP induced by a unit increase in CSP. Both initial slope (dotted lines) and steady-state response are attenuated in CHF. d Transfer function from CSP to HR. The bottom panel represents the HR step response calculated from the transfer function. Both initial slope (dotted lines) and steady-state response are attenuated in CHF. In each plot, bold and thin lines indicate mean and mean ± SE, respectively
