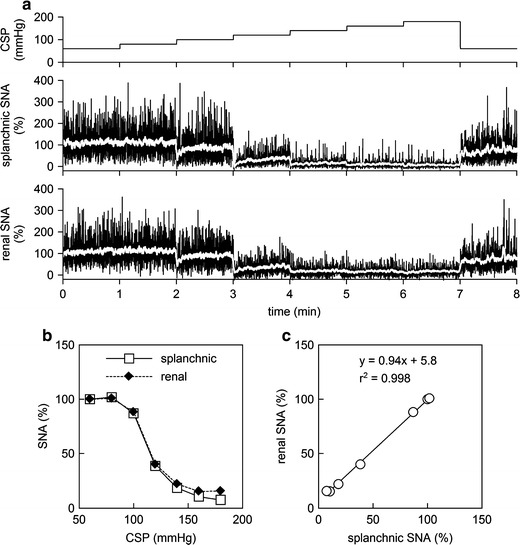
Fig. 7.

a Typical recordings of 10-Hz decimated CSP, splanchnic SNA, and renal SNA obtained from a normal rat in an additional study using the same experimental settings as the main study. The white lines in the SNA recordings represent 2-s moving averaged signals. An increase in CSP decreased splanchnic and renal SNAs. b Static characteristics of the baroreflex neural arc drawn based on splanchnic and renal SNAs. c Correlation between splanchnic and renal SNAs during the stepwise input protocol. In panels b and c, splanchnic and renal SNA data were obtained as the averaged values during the last 10 s at each CSP level
