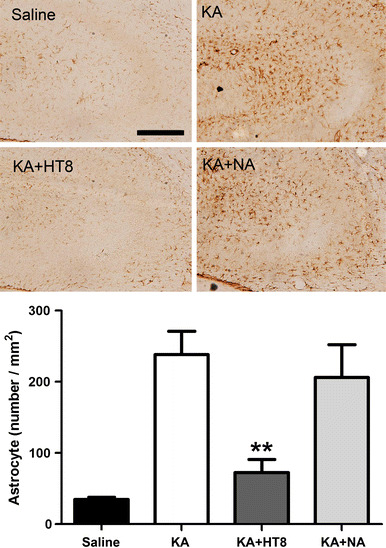
Fig. 3.

The expressions of GFAP-positive cells in hippocampal CA3 region after kainic acid (KA) administration. Saline saline injected control group; KA KA injected group; KA + HT8 acupuncture at HT8 with KA injection group; KA + NA acupuncture at tail with KA injection group. Scale bar 100 μm. All data are presented as the mean ± SEM. **P < 0.01 versus KA group
