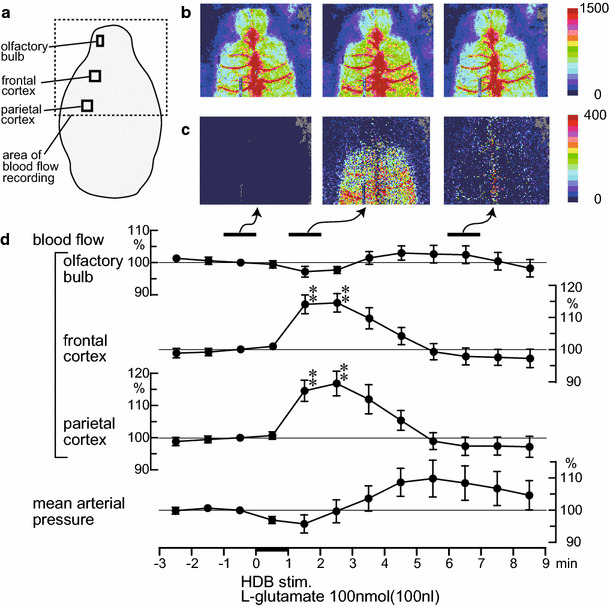
Fig. 3.

Spatiotemporal changes in the regional cerebral blood flow following a microinjection of l-glutamate (100 nmol in 100 nl) into the HDB. a Area of blood flow recorded by a laser speckle contrast imager is indicated by the dotted line. b,c Sample recording of the regional cerebral blood flow in one rat. b Averaged signal over selected periods of 1 min. c Differential signal changes obtained from b when subtracting the baseline (−1 to 0 min) signal from subsequent images. d Percentage signal changes in the olfactory bulb, frontal, and parietal cortices ipsilateral to the HDB stimulation (data extracted from the ROIs indicated by the black squares in a) and mean arterial pressure averaged every 1 min (n = 8). Each point and vertical bar represent a mean ± SEM. ** p < 0.01; significantly different from the pre-stimulus control values (−1 to 0 min) using a one-way repeated-measures ANOVA followed by a Dunnett’s multiple comparison test
