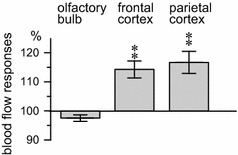
Fig. 4.

Differences in the blood flow response between the olfactory bulb and cerebral cortices (frontal and parietal cortices) by focal chemical stimulation of the HDB. Percent changes in the blood flow for each area 1–2 min after the onset of the l-glutamate injection are presented (n = 8). Statistical comparisons for each measure are reported in Fig. 3 and associated text
