Fig. 5.

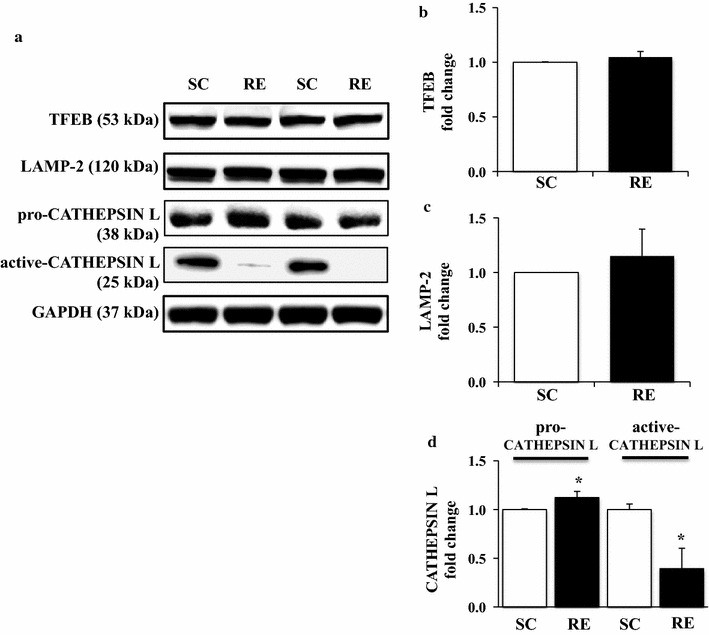
Changes in the expression level of both lysosomal biogenesis markers (TFEB, LAMP-2) and degradation marker (pro/active CATHEPSIN L) in FDP muscles in response to 8 weeks of resistance exercise training. a Representative western blot images of TFEB, LAMP-2, and pro/active CATHEPSIN L in each group. b Quantification of TFEB. c Quantification of LAMP-2. d Quantification of pro/active CATHEPSIN L. Comparisons of each target protein expression were made after normalization to GAPDH. SC sedentary control group, RE resistance exercise group. *p < 0.05 vs. SC
