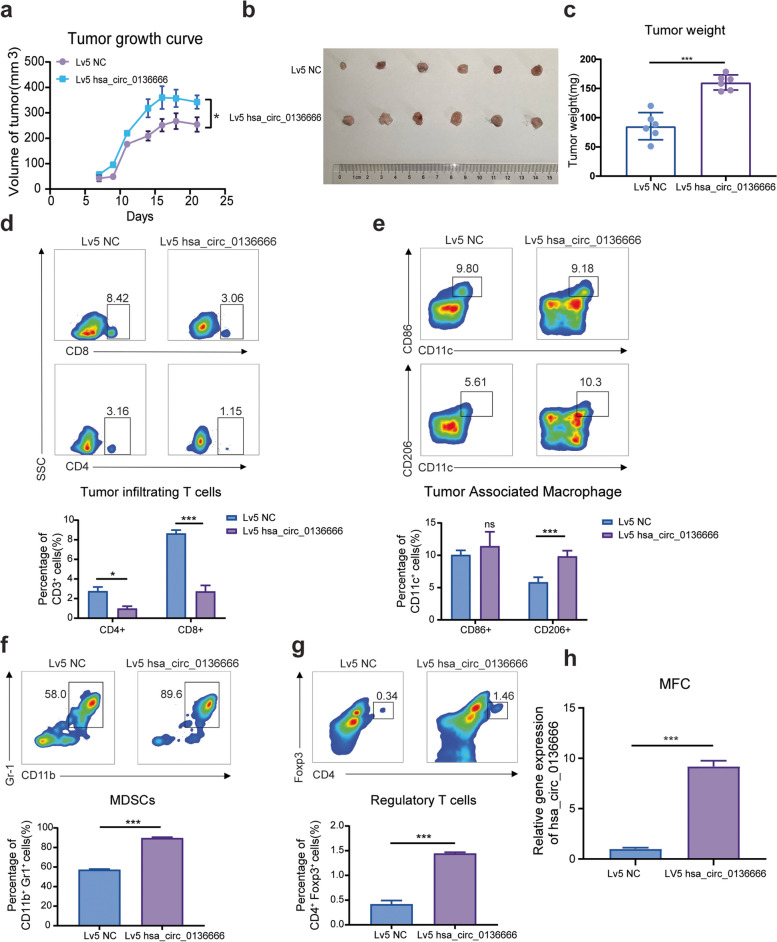
Fig. 3.
Hsa_circ_0136666 regulates antitumor immune responses driven toward immune escape. a Tumor growth curve of tumor bearing mice with Lv5 MFC cells. b Original photo of mouse tumor. c Comparison of tumor weight in mice. d Differences in the proportion of tumor infiltrating T lymphocytes. e Differences in the proportion of tumor associated macrophages. f Differences in the proportion of tumor infiltrating MDSC cells. g Differences in the proportion of tumor infiltrating regulatory T cells. Data are presented as the mean ± SD, n = 6, Student's t-test was used. *P < 0.05, ***P < 0.001. h The overexpression of hsa_circ_0136666 in MFC. ***P < 0.001

