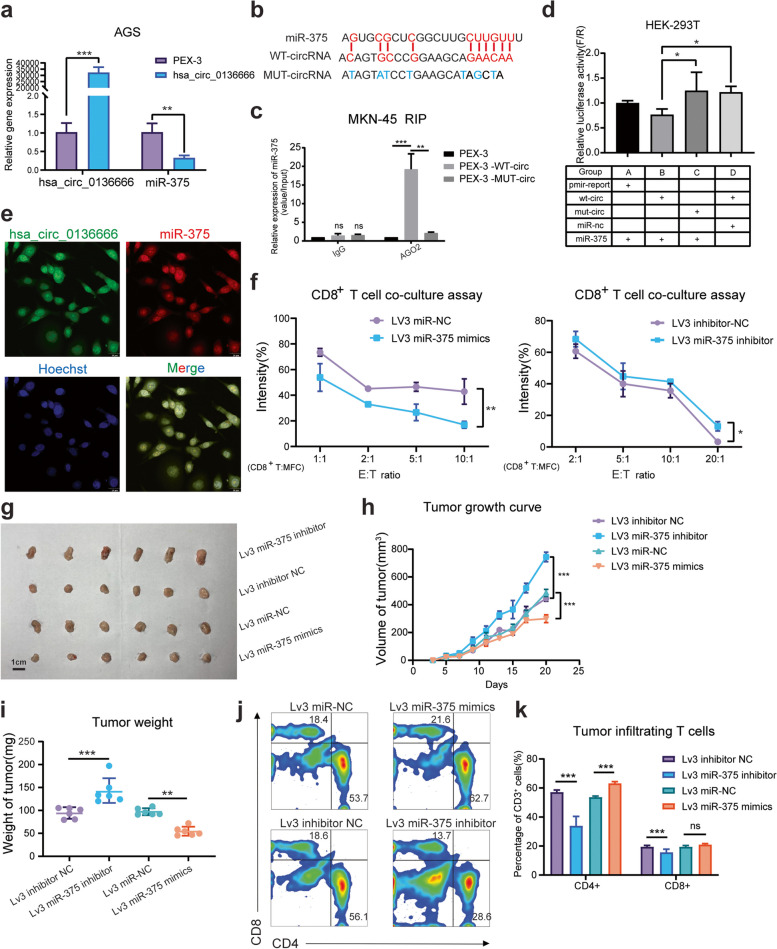
Fig. 4.
Hsa_circ_0136666 regulates gastric cancer progression via miR-375 sponge. a The negative correlation between the relative expression of hsa_circ_0136666 and miR-375, n = 3. b MiR-375 has complementary base pairing sites with wild-type hsa_circ_0136666. c RIP experiment was used to verify that hsa_circ_0136666 exerts sponge function, n = 3. d Dual luciferase reporter assay was used to verify the interaction between hsa_circ_0136666 and miR-375, n = 6. e RNA in situ hybridization was implemented to verify the colocalization of hsa_circ_0136666 with miR-375. f Image of survival rate of overexpressing and knockdown hsa_circ_0136666 tumor cells co-cultured with CD8+ T cells, n = 6. g Original photo of tumor in Lv3 miR-375 tumor bearing mice. h Tumor growth curve of Lv3 miR-375 tumor bearing mice, n = 6. i Comparison of tumor weight in mice, n = 6. j Differential distribution of tumor infiltrating T lymphocytes in different groups of Lv3 tumor bearing mice, n = 6. k Quantitative distribution of tumor infiltrating T lymphocytes in different groups, n = 6. Data are presented as the mean ± SD, Student's t-test was used. *P < 0.05, **P < 0.01, ***P < 0.001

