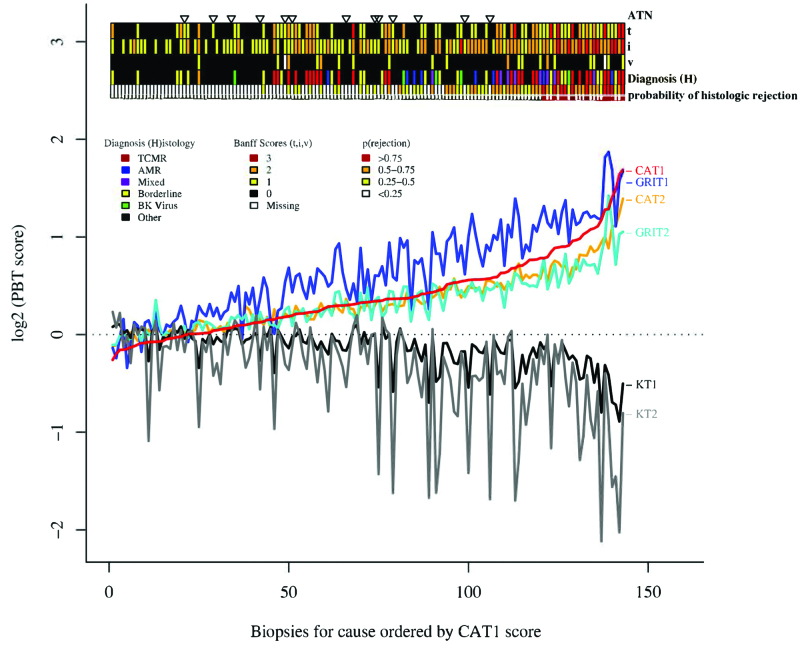
FIGURE 4.
Relationship between PBT scores, histopathologic lesions, histologic diagnosis, and classifier predictions.78 Biopsies for cause (N = 143) were sorted based on the CAT1 score (from lowest to highest). According to this order, scores for all PBTs (CAT1, CAT2, GRIT1, GRIT2, KT1, and KT2) are illustrated for each individual biopsy for cause. The panel above the graph illustrates the relationship of the PBT scores to the histologic diagnosis of ATN, the interstitial infiltrate (i score), tubulitis (t score), intimal arteritis (v score), and the probability of rejection (%) predicted from a classifier. Biopsies were sorted based on the CAT1 score, and the relationship between PBT scores, diagnosis, and classifier predictions are shown. ATN, acute tubular necrosis; CAT, cytotoxic T lymphocyte-associated transcripts; GRIT, IFNG-inducible transcripts; i, interstitial infiltrate; KT, kidney transcripts; PBT, pathogenesis-based transcript set; t, tubulitis; v, intimal arteritis.

