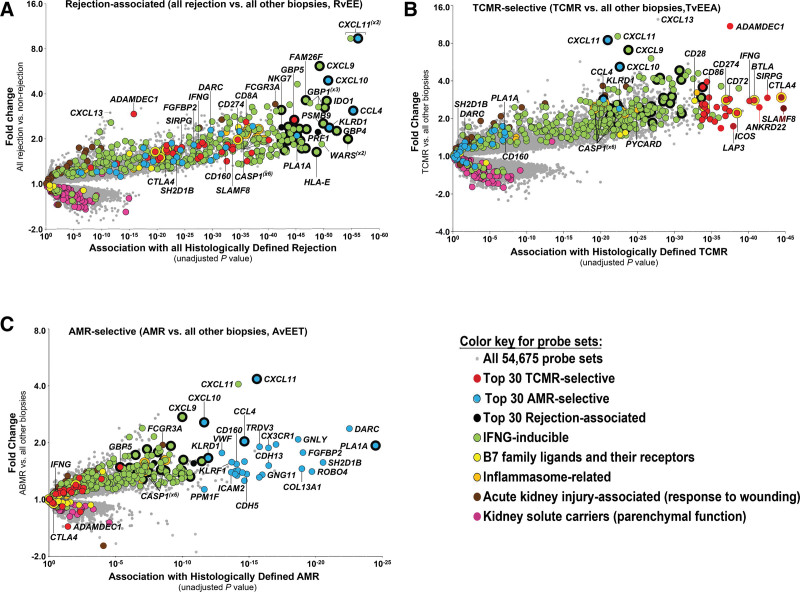
FIGURE 5.
Landscapes of molecular rejection in kidney transplant biopsy populations shown as volcano plots.47,79,80 Each transcript is shown as a point on the plot, colored by its annotation (if the annotation is available). Fold change of each transcript is shown on the y-axis, and association along the x-axis. Most significant transcripts will appear in the top right corner of each plot. The molecular landscapes of (A) all rejection, (B) TCMR, and (C) AMR. AMR, antibody-mediated rejection; TCMR, T cell–mediated rejection.

