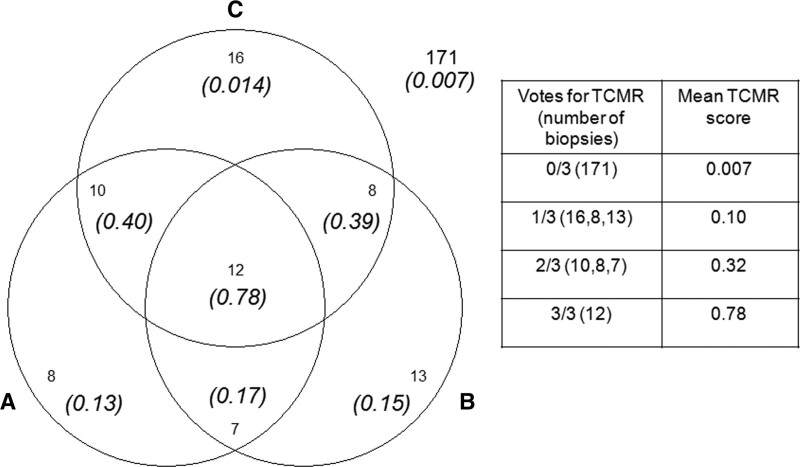
FIGURE 9.
Venn diagram showing the relationship between the molecular TCMR score and the agreement among 3 pathologists (“A,” “B,” and “C”) in the 245 biopsy subset.60 Numbers in italics show the average molecular TCMR score in the biopsies. Numbers with no parentheses are the intersections of the number of biopsies diagnosed as TCMR by the 3 pathologists. One hundred seventy-one biopsies were called no TCMR by all 3 pathologists (mean TCMR score of 0.007, numbers outside of the diagram). Biopsies with either i2t2 TCMR or mixed rejection were considered TCMR. Isolated v-lesion TCMRs were not counted as TCMR. AMR, antibody-mediated rejection; TCMR, T cell–mediated rejection.

